Following on the recent hype around the robot that is able to solve a Rubik’s cube in a second (which seems a big improvement over the previous robot that was able to solve it in about 3 seconds), I got interested in human records, and their evolution over the year.
The World Cube Association provides dataset about ranking, records, players in Rubik’s Cube competitions. They offer a downloadable dataset for data science purpose. But since it would be too easy to use a TSV ;), I’ll show how we can extract data from this website, and use Pandas get some insight.
Players
We’ll first try to explore data about results of Worldwide competitions that we can find on this page.
Let’s use requests to fetch HTML from the URL. If you go directly on the page, you’ll see that you can select the number of results you’re interested in, countries, years, etc. All theses parameters can be specified in the URL too. In this post, I’ll use all the data (all players, all years, all countries):
import requests
r = requests.get("https://www.worldcubeassociation.org/results/events.php?eventId=333®ionId=&years=&show=All%2BPersons&single=Single")
Beautifulsoup will let you manipulate HTML without dealing too much with low-level details.
from bs4 import BeautifulSoup
soup = BeautifulSoup(r.text, 'html.parser')
You can ask him to find and extract one particular part of the HTML, in our case it would be table-responsive which represents the array of results:
table = soup.find("div", {"class": "table-responsive"})
raw_lines = [
    line.contents[:5]
    for line in table.find_all("tr")
    if len(line) == 6
]
raw_lines[0]
1 | Lucas Etter | 4.90 | USA | River Hill Fall 2015 — | — | — | — |
We get a list of HMTL Entities that we will process to extract the data we need. But first, let’s automate this extraction process with a function, since every tables on this website respect the same format:
from bs4 import BeautifulSoup
import requests

def get_table_raws(url, cols):
    r = requests.get(url)
    soup = BeautifulSoup(r.text, 'html.parser')
    table = soup.find("div", {
        "class": "table-responsive"
    })

    raw_lines = [
        line.contents
        for line in table.find_all("tr")
        if len(line) == cols
    ]

    return [[c.text for c in line] for line in raw_lines]
Since we’ll have to deal with dates and timings, we could use this little helpers to do the conversions:
def extract_year_from_competition(competition):
    # Format is [name] [year]
    return int(competition.strip().rsplit(' ', 1)[-1])

def convert_timing_to_seconds(timing):
    try:
        # Try to convert directly in seconds
        return float(timing)
    except ValueError:
        try:
            # Format should be [minutes]:[seconds].[tenth]
            minutes, rest = timing.split(":", 1)
            seconds, tenth = rest.split(".", 1)
            return (
                float(minutes) * 60 +
                float(seconds) +
                float(tenth) / 100
            )
        except ValueError:
            return None
Let’s use our helpers to extract all the data:
url = "https://www.worldcubeassociation.org/results/events.php?eventId=333®ionId=&years=&show=All%2BPersons&single=Single"
clean_table = []
for rank, (_, person, timing, country, competition, _) in enumerate(get_table_raws(url, 6)):
year = extract_year_from_competition(competition)
timing = convert_timing_to_seconds(timing)
clean_table.append((rank + 1, person, timing, country, competition, year))
clean_table[:5]
[(1, u'Lucas Etter', 4.9, u'USA', u'River Hill Fall 2015', 2015),
 (2, u'Keaton Ellis', 5.09, u'USA', u'River Hill Fall 2015', 2015),
 (3, u'Collin Burns', 5.25, u'USA', u'Doylestown Spring 2015', 2015),
 (4, u'Feliks Zemdegs', 5.39, u'Australia', u'World Championship 2015', 2015),
 (5, u'Mats Valk', 5.55, u'Netherlands', u'Zonhoven Open 2013', 2013)]
len(clean_table)
47465
Let’s see if we can gain some insight from this dataset using Pandas:
import pandas as pd
import numpy as np

df = pd.DataFrame(
    data=clean_table,
    columns=(
        'Rank',
        'Person',
        'Timing',
        'Country',
        'Competition',
        'Year'
    ))

df.head()
Rank Person Timing Country Competition Year 1 Lucas Etter 4.9 USA River Hill Fall 2015 2015 2 Keaton Ellis 5.09 USA River Hill Fall 2015 2015 3 Collin Burns 5.25 USA Doylestown Spring 2015 2015 4 Feliks Zemdegs 5.39 Australia World Championship 2015 2015 5 Mats Valk 5.55 Netherlands Zonhoven Open 2013 2013
We see that the first entry is the World record by Lucas Etter. If you didn’t see, watch it now, it’s very impressive.
df["Timing"].describe()
| — | — count |
47465.000000mean |35.078421std |27.492358min |4.90000025% |17.35000050% |26.72000075% |43.830000max |648.000000
Name: Timing, dtype: float64
We have 47465 entries. The average time of resolution in these competitions is 35 seconds, which is actually pretty fast. The maximum, of 648 seconds (10 minutes) seems more reasonable to me…
%matplotlib inline
import matplotlib.pyplot as plt
plt.style.use('ggplot')
We can count the number of players for each country:
country_count = df[["Country"]].apply(pd.value_counts)
country_count[:20]
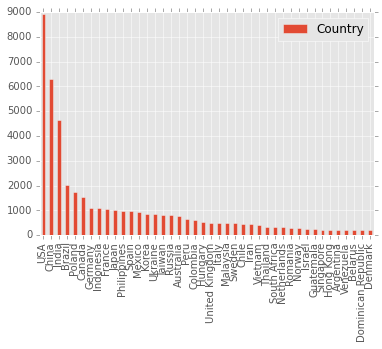
Country Count USA 8918 China 6286 India 4659 Brazil 2039 Poland 1739 Canada 1526 Germany 1092 Indonesia 1090 France 1065 Japan 999 Philippines 993 Spain 977 Mexico 932 Korea 869 Ukraine 848 Taiwan 828 Russia 817 Australia 766 Peru 671 Colombia 627
No surprise, bigger countries are more represented in Rubik’s Cube competitions. It would be interesting to compare these numbers with the actual population, to see if Rubik’s Cube is more “popular” in some countries.
Let’s visualize the countries with more than 200 players using a barplot:
country_count[country_count > 200].dropna().plot(kind="bar")
We can do the same for players:
df[["Person"]]
    .apply(pd.value_counts)
    .apply(pd.value_counts)
Number of participations Count 1 46709 2 305 3 26 4 13 5 2 6 1
It appears that the vast majority of player only participated one time. And only about 0.007% participated more than once. Can we conclude that players are more hobbyist than professional? Another information that could be interesting is the age of the participants, since the World Champion is very young, it would be fun to have more insight about the average or mean age of Rubik’s Cube champions.
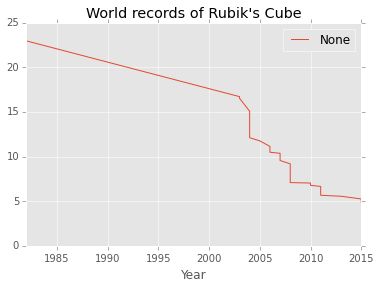
Records
Let’s now get to the world records, and try to see how they evolve over the years. The code is pretty similar to the previous section, so we’ll just use our generic function for table extraction:
url = "https://www.worldcubeassociation.org/results/regions.php?regionId=&eventId=333&years=&history=History"
clean_table = []
for (_, single, avg, person, country, competition, _) in get_table_raws(url, 7):
    single = convert_timing_to_seconds(single.strip())
    avg = convert_timing_to_seconds(avg.strip())
    year = float(extract_year_from_competition(competition))
    clean_table.append((person, single, avg, country, competition, year))

clean_table[:5]
[
  (u'Lucas Etter', 4.9, None, u'USA', u'River Hill Fall 2015', 2015.0),
  (u'Collin Burns', 5.25, None, u'USA', u'Doylestown Spring 2015', 2015.0),
  (u'Mats Valk', 5.55, None, u'Netherlands', u'Zonhoven Open 2013', 2013.0),
  (u'Feliks Zemdegs', 5.66, None, u'Australia', u'Melbourne Winter Open 2011',
  2011.0),
  (u'Feliks Zemdegs',
   6.18,
   None,
   u'Australia',
   u'Melbourne Winter Open 2011',
   2011.0)
]
df = pd.DataFrame(
    data=clean_table,
    columns=('Person', 'Single', 'Avg', 'Country', 'Competition', 'Year'))

df.head()
Person | Single | Avg | Country | Competition | Year — | — | — | — | — | 0 | Lucas Etter | 4.90 |
NaN| USA | River Hill Fall 2015 | 2015 1 | Collin Burns | 5.25 |NaN| USA | Doylestown Spring 2015 | 2015 2 | Mats Valk | 5.55 |NaN| Netherlands | Zonhoven Open 2013 | 2013 3 | Feliks Zemdegs | 5.66 |NaN| Australia | Melbourne Winter Open 2011 | 2011 4 | Feliks Zemdegs | 6.18 |NaN| Australia | Melbourne Winter Open 2011 | 2011
df = df.sort(["Year", "Single"], ascending=[True, False])
df[df["Single"].notnull()].plot(x="Year", y="Single", legend="Test")
plt.title("World records of Rubik's Cube")
Last words
It would seem reasonable to conclude that we are now on a plateau. One think that could bring even more insight would be to compare this evolution to, say, evolution among sprinters’ world records over time, etc. I guess we’re hitting the same kind of limitation.
A major difference is that in Rubik’s Cube, you’re limited both by your fingers’ dexterity, and the speed at which your brain can process information, whereas in athletics, it’s more about physical performance. I would be curious to see which one is more limiting: brain, or body.
Another open question for me is: how much does the final score depends on the initial configuration of the Rubik’s Cube? I know that they are able to look at it before the beginning, so maybe this is negligible, maybe not.